First time 100K visits over month period. 20M clicks & reaching 3M sessions overall.


First time 100K visits over month period. 20M clicks & reaching 3M sessions overall.
*** update IV/2017: from comment below, check this great raster plug-in from Victor Veralde Gutiérrez too: https://github.com/IHCantabria/Leaflet.CanvasLayer.Field/ ***
I have got great, absolutely amazing joy today from my own open source experiment. In 2014, nearly 2 years ago, I have published on GitHub (gist) L.CanvasOverlay a small class to handle generic drawing on top of Leaflet, I was thinking let’s try to contribute back to the open source with this little snippet – I thought would be useful so I have added little description. Original blog post here: http://blog.sumbera.com/2014/04/20/leaflet-canvas/
After few months later I found it is used on http://windyty.com one of the best 2015 geo-visualization with huge popularity. It is a small part of this great app, but makes me feel so good like I am part of it, I am looking on something where is my small piece, small share…meaning of the effort, sense of publishing and open sourcing.

And today I have got echo it is used also in Marine National Facility here: http://www.cmar.csiro.au/data/underway.test/
This makes me so happy … and just came across this quote : “Revenue is a lagging indicator, usage is a leading indicator,” can’t remember, who just said that ? 🙂

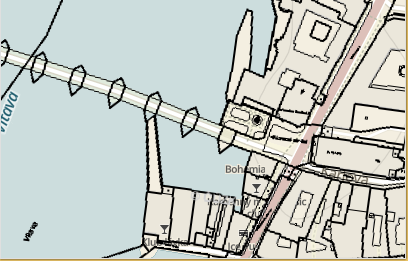
update 07/2025: recovered demo here: https://www.sumbera.com/gist/js/leaflet/svg/scaled/SVGScaled.html
SVG can be drawn on map in much more faster way than traditional approaches, at least for points. Traditional approach re-position each element to fit into the view of the map, however SVG is “scalable” so we can use it and it performs much more faster for zoom-in/out.
Few considerations:
most important things happen in moveEnd event:
 var bounds = this._map.getBounds(); // -- latLng bounds of map viewport
 var topLeftLatLng = new L.LatLng(bounds.getNorth(), bounds.getWest()); // -- topLeft corner of the viewport
 var topLeftLayerPoint = this._map.latLngToLayerPoint(topLeftLatLng); // -- translating to view coord
 var lastLeftLayerPoint = this._map.latLngToLayerPoint(this._lastTopLeftlatLng);

 var zoom = this._map.getZoom();
 var scaleDelta = this._map.getZoomScale(zoom, this._lastZoom); // -- amount of scale from previous state e.g. 0.5 or 2
 var scaleDiff = this.getScaleDiff(zoom); // -- diff of how far we are from initial scale

 this._lastZoom = zoom; // -- we need to keep track of last zoom
 var delta = lastLeftLayerPoint.subtract(topLeftLayerPoint); // -- get incremental delta in view coord

 this._lastTopLeftlatLng = topLeftLatLng; // -- we need to keep track of last top left corner, with this we do not need to track center of enlargement
 L.DomUtil.setPosition(this._svg, topLeftLayerPoint); // -- reset svg to keep it inside map viewport

 this._shift._multiplyBy(scaleDelta)._add(delta); // -- compute new relative shift from initial position
 // -- set group element to compensate for svg translation, and scale</pre>
 this._g.setAttribute("transform", "translate(" + this._shift.x + "," + this._shift.y + ") scale(" + scaleDiff + ")");
Test page / Gist : http://bl.ocks.org/Sumbera/7e8e57368175a1433791
To better illustrate movement of SVG inside the map, here is a small diagram of basic SVG states:
 Recent months I have been programming “Green Space Analyzer” web app that shows modern approach to visualize and query multi temporal geospatial data. User see information in a form he can interact with and discover new patterns, phenomena or information just by very fast ‘feed-back’ of the UI response on the user input. When user selects for example certain area, all graphs instantly animates transition to reflect selection made, this helps to better understand dynamics of the change. Animation can be seen everywhere – from labels on bar chart, through colors change of the choropleth up to title summary. it creates subtle feeling of control or knowing what has changed and how it has changed. At HxGN 15 conference in hexagon geospatial keynote, CEO Mladen Stojic showcased it as part of the vision called Smart M.App, worth to look at (at 52:40 starts Smart M.App demo):
my Smart M.App ‘world tour’:


Simple & strightforward test of loading shape file and drawing it on MapKit on iOS8 using drawMapRect
GitHub:https://github.com/Sumbera/SHPonMapKit
Reading of shape file is performed by shapelib
//------------------------------------------------------------
NS_INLINE NSArray *getPolygonsFromShapeFile(NSString *shpFilePath){

    const char *path = [shpFilePath cStringUsingEncoding:NSUTF8StringEncoding];
    SHPHandle shp = SHPOpen(path, "rb");
    int numEntities;
    int shapeType;

    SHPGetInfo(shp, &numEntities, &shapeType, NULL, NULL);

    NSMutableArray *allPolygons = [[NSMutableArray alloc]init];
    for (int i=0; i<numEntities; i++){
       SHPObject *shpObject = SHPReadObject(shp, i);
       if (shpObject->nSHPType == SHPT_POLYGON ||
           shpObject->nSHPType == SHPT_POLYGONZ ||
           shpObject->nSHPType == SHPT_POLYGONM){

            int numParts = shpObject->nParts;
            int totalVertexCount = shpObject->nVertices;

            for (int n=0; n<numParts; n++)
            {
                int startVertex = shpObject->panPartStart[n];
                int partVertexCount = (n == numParts - 1) ? totalVertexCount - startVertex : shpObject->panPartStart[n+1] - startVertex;
                int endIndex = startVertex + partVertexCount;

                CLLocationCoordinate2D coords[partVertexCount];
                for (int pv = startVertex, i = 0; pv < endIndex; pv++,i++) {
                    coords[i] =CLLocationCoordinate2DMake(shpObject->padfY[pv],
                                                          shpObject->padfX[pv]);
                }
                // -- this actually converts lat lon to mkmappoints projection
                MKPolygon *singlePolygon = [MKPolygon polygonWithCoordinates:coords count:partVertexCount];
                [allPolygons addObject:singlePolygon];
            }
       }

     SHPDestroyObject(shpObject);

  }
    SHPClose(shp);

    return [allPolygons copy];
}
credits/inspiration:
drawing : http://stackoverflow.com/questions/17673410/mkmapview-with-multiple-overlays-memory-issue
parsing : http://www.al-tyus.com/blog/2013/10/14/mapkit-and-esri-shapefiles
shapelib: http://shapelib.maptools.org
dala: http://www.geoportalpraha.cz

update 07/25: demo recovered here https://www.sumbera.com/gist/js/vt/geojson_vt.html
update Sept 2015: nice explanation of how geojson-vt works here
Mapbox technologies used in their webgl and opengl libraries are being extracted into standalone pieces. Vladimir Agafonkin,creator of leaflet.js, earcut.js provided slicing and polygon simplification library for geojson called Goejson-vt.Geojson-vt can slice geosjon into tiles aka mapbox tiles.
Quick test and sample of using geojson-vt on leaflet with canvas drawing available here: http://bl.ocks.org/sumbera/c67e5551b21c68dc8299
2 videos:
Overview of various geojson samples
folowing video shows 280 MB large geojson !
for comparison here is WebGL version on the same data. This version is loading all data into GPU and leaves everything on WebGL (no optimization). It also takes slightly more time to tessellate all polygons, but once done all seems to run fine. Code used is available here
 Source: colorful introduction to Linear Algebra (may 2014) Cosine Similarity – understanding it as volume of parallelepiped
  Another good source for understanding dot product : http://betterexplained.com/articles/vector-calculus-understanding-the-dot-product/

other resources:
Significance &Application of Cross product and Dot product. http://visualizingmathsandphysics.blogspot.cz/2013/06/vectors-significance-of-cross-product.html
Independence of Perpendicular components of the motion http://www.physicsclassroom.com/Class/vectors/u3l1g.cfm
Math Insight: http://mathinsight.org/dot_product
$latex \frac{a\cdot b}{\left \| a\right \|}= cos\alpha \left \| b \right \| &s=4$
“projection” of vector b on a equals cosine of angle between them times the length of b or vice versa projection of a on b:

Dot product Identities, some pictures taken from http://gamemath.com/

Quick and dirty test of the WMS capabilities of the new MapBox-gl-js 0.5.2 API. First of all, yes ! it is possible to overlay (legacy) WMS over the vector WebGL rendered base map … however the way is not straightforward:
Code is documented to guide you through the process, few highlights:
 // -- rutine originaly found in GlobalMercator.js, simplified
 // -- calculates spherical mercator coordinates from tile coordinates
 function tileBounds(tx, ty, zoom, tileSize) {
    function pixelsToMeters(px, py, zoom) {
     var res = (2 * Math.PI * 6378137 / 256) / Math.pow(2, zoom),
         originShift = 2 * Math.PI * 6378137 / 2,
         x = px * res - originShift,
         y = py * res - originShift;
     return [Math.abs(x), Math.abs(y)];
     };
   var min = pixelsToMeters(tx * tileSize, ty * tileSize, zoom),
         max = pixelsToMeters((tx + 1) * tileSize, (ty + 1) * tileSize, zoom);
return min.concat(max);
}
]

// -- save orig _loadTile function so we can call it later
 // -- there was no good pre-load event at mapbox API to get hooked and patch url
// -- we need to use undocumented _loadTile
 var origFunc = sourceObj._loadTile;
    // -- replace _loadTile with own implementation
 sourceObj._loadTile = function (id) {
    // -- we have to patch sourceObj.url, dirty !
    // -- we basically change url on the fly with correct BBOX coordinates
    // -- and leave rest on original _loadTile processing
     var origUrl =sourceObj.tiles[0]
                      .substring(0,sourceObj.tiles[0].indexOf('&BBOX'));
     var origUrl = origUrl +"&BBOX={mleft},{mbottom},{mright},{mtop}";
     sourceObj.tiles[0] = patchUrl(id, [origUrl]);
     // -- call original method
     return  origFunc.call(sourceObj, id);
 }
gist available here
demo here (Chrome): https://www.sumbera.com/gist/js/mapbox/index.html
Interesting to see few graphs showing number of downloads of the ArcGIS vs iKatastr2 on iOS for Czech Republic. Data are taken from AppAnnie.com (login requiered).
iPhone:


iPad


Notes from Jenkov.com : http://tutorials.jenkov.com/angularjs/critique.html about AngularJS Declarative vs Imperative. Couldn’t say this better…the art is to find right balance. Neither XAML , nor AngularJS found it yet (too declarative):
Quoted from the source:
Using declarative HTML templates with a bit of data binding injected is not a new idea. It has been tried before in JSP (JavaServer Pages). Here is an example:
<span><%=myObject.getMyProperty()%></span>
In AngularJS it would look like this:
<span>{{myObject.getMyProperty()}}</span>
Declarative languages (such as HTML and XML) are good a modeling state such as documents, or the overall composition of a GUI. Imperative languages (such as JavaScript, Java, C etc.) are good a modeling operations. The syntaxes of both declarative and imperative languages were designed to support their specific purposes. Therefore, when you try to use a declarative language to mimic imperative mechanisms it may work for simple cases, but as the cases get more advanced the code tend to become clumsy
The same is true the other way around. Using an imperative language will often also get clumsy. Anyone who has tried writing an HTML document using JavaScript’s document.write() function, or wired up a Java Swing GUI using Java, or an SWT GUI for that matter, knows how clumsy this code can get.
…
It is easy to think that the declarative / imperative mismatch can be avoided with a programming language that is designed to handle both paradigms. But the problem goes deeper than the language syntax.
It is not the syntax of a programming language that decides if the language is declarative or imperative. It is the semantic meaning of what the language describes that decides between declarative and imperative. You could invent a more Java-like syntax to describe HTML elements. Or a more HTML-like syntax to describe Java instructions. But such syntaxes would not change the fact that one language describes state (HTML documents) and the other language describe commands (operations). Thus, a Java-like syntax for describing HTML documents would still be declarative, and a more HTML-like syntax for describing Java-operations would still be imperative.
…